
Process Improvement Tools.
Standard Work.
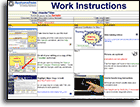
Work Instructions.
Flow Chart templates.
Swim Lane Cross Functional Flowchart.
Value Stream Mapping.
Lean tools.
Yamazumi Chart template.
Time Study templates.
DMAIC tools.
Quality Improvement tools.
House of Quality QFD.
FMEA Risk Reduction.
Root Cause Analysis tools.
Problem Solving tools.
OEE.
Preventive Maintenance.
Skip to main content


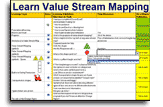


Value Stream Mapping


Installation and Setup
Installation - Each User. Installation - Multi-user. Language Translations. Personalize Your Templates.Systems2win Training.
Quick Start Initial Training. New User Training. Training Matrix. Systems2win Leadership. Training Classes.Lean Training
Lean Training and Coaching. Lean Principles. Muda 8 Wastes. Goal - Lean Flow. Roadmap - Lean Journey. Value Stream Mapping. Standard Work. Hansei Lean Thinking. Lean Dictionary. Online Lean Training. Lean Leadership.Microsoft Office Training
Excel Training. Excel Drawings (without Visio). Excel Charts. Word Training. PDF Training. Document Storage and Naming.Support
Support.Value Stream Mapping
How to use your value stream mapping tools for value stream analysis and management
Value Stream Mapping Tools
If you already have lots of experience with value stream mapping,
then you might want to jump to the training to learn how your value stream mapping templates can help your team manage your value streams... better
If you have that much experience with value stream mapping,
then you already know how important it is to follow ALL of the steps of the value stream mapping process
(many of which don't involve Excel templates)
That is the purpose of the training on this page...
to provide step-by-step instructions for how to do value stream mapping (correctly)
What is Value Stream Mapping?
Value Stream Mapping is a lean method
1) to define, measure, analyze, improve, and control the flow of "the thing being transformed"
which could be inventory, a medical patient, paperwork, or anything in any segment of any value chain
Your team will use many value stream mapping tools
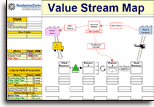
the most popular being the Value Stream Mapping template, which has extensive features for Value Stream Analysis
Video: Value Stream Mapping
Introduction to Training
6 more Purposes of Value Stream Mapping
2) to make is easy to see the 7 deadly types of waste
that suddenly become so apparent as your team devotes attention to lean flow
3) to provide a holistic, inter-connected, birds-eye CUSTOMER perspective
of how value flows between many separately-managed teams that are often unaccustomed to looking at things from a perspective outside of their own small team
4) to provide "True North" direction
to strategically align the many small and large decisions made by many wide-spread teams
5) to highlight problems and proposed countermeasures
in simple, visual, and compelling ways
that often cause previously skeptical team members to suddenly agree that "we really can't keep doing things the way we've been doing them"

6) to serve as a value stream management dashboard
to continuously measure, analyze, improve, and control the inter-related processes in your value stream
7) to quickly orient new hires
to understand how their job affects and is affected by the many interconnected jobs downstream and upstream
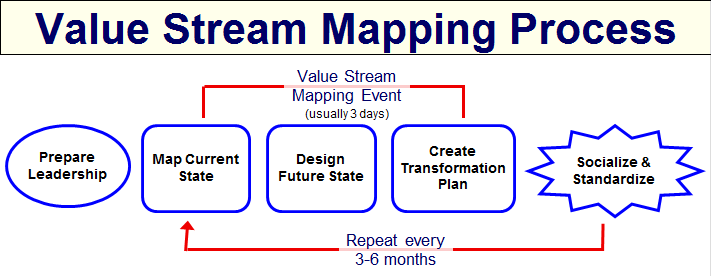
The Value Stream Mapping Process
Value Stream Mapping Steps
Step 1) Prepare your Leadership
Who: Continuous Improvement Steering Committee, and Continuous Improvement Leadership Team
Value Stream Mapping is a team sport.
A value stream map created by one individual is worse than useless.
It will actually prove destructive to your future efforts to do it right.
Before your Value Stream Team ever starts mapping,
your Continuous Leadership Team should have already done quite a lot of preparation, using your Lean Leadership tools to launch your team, and following the steps described in Phase 1 of a Typical Lean Journey.
Road map for a typical
Lean Transformation
Assuming that this groundwork has been properly prepared...
your Value Stream Team should now be ready to begin fulfilling its Team Charter.
Define Product Families
Use your Product Family Matrix template
to segregate your offerings into clearly-defined product families
(for simplicity, we use the term 'Product Families' for both product and service families)
There is usually 1 primary value stream map per product family
Define supporting value streams
In addition to the value streams that provide value directly to your end customers,
you will (eventually) also define 'supporting value streams' that support your 'production value streams'
Examples might include: Purchasing, Accounting. Human Resources, etc.
Almost always, these supporting value streams will actually be segments of a larger (customer-facing) value stream:
Segments that are shared by multiple value streams.
Segments that are very similar between multiple value streams.
Value Stream Mapping Step 2
Map the Current State Value Stream
Who: Value Stream Team
Describe Customers and key Suppliers
If a primary purpose of value stream mapping is to analyze and improve the flow of the thing being transformed from the perspective of your end customer...
then the place to start... is to seek to better understand the perspective of your target customer,
right?
Describe everything that might be relevant about the customers and suppliers for this value stream.
Use your Systems2win templates such as the Customer Wants template, (VOC_Wants.docx)
Voice of the Customer Kano template, (VOC_Kano.xlsx)
SIPOC Diagram template, (SIPOC.xlsx)
but don't limit yourself to just those templates.
Describe your customers in many creative, insightful ways.
Define the scenario to map
Caution: This is where a lot of Value Stream Teams go wrong
Your Current State Map should be for one very narrowly defined scenario
even though the future state will almost always apply to a far broader range of scenarios.
Example:
Your Current State Map might narrowly focus on one type of request from one type of customer (or even just one specific customer) that might account for only perhaps 5-10% of demand served by this value stream
and yet the changes that you propose for your future state will often benefit many other (somewhat similar) types of requests from similar customers. (perhaps applying to 50-80% of demand)
If you personally don't have a lot of experience creating Current State Value Stream Maps... then please just trust us on this one.
Define one VERY specific scenario, and create a Current State Map for just that one scenario.
Leadership Tip:
Team members will often want to discuss exceptions to the narrowly-defined scenario that your team chose to analyze.
When that happens, simply jot those exceptions down in the 'Exceptions and Scenarios' text box
then gracefully steer the conversation back on track, with the assurance that the team WILL come back to those exceptions AFTER doing a thorough deep dive into your one chosen scenario.
Walk the gemba and interview workers
Gemba = the place where the actual work is done
Go there... with your entire team
Don't split up into sub-groups.
The entire team should walk the gemba together, but divvy up assignments:
e.g. Interviewer, documenter, timer, issues and ideas recorder, photographer, existing documentation gatherers...
Don't gather metrics yet.
Just go look, and listen.
REALLY look, and REALLY listen.
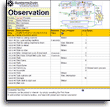
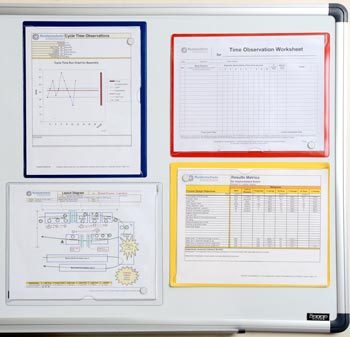
Using your Process Observation Worksheet (Observation.xlsx)
and Gemba Interview questionnaire (GembaInterview.xlsx)
Pretend that you are the thing being transformed — physically following its route through the process flow, and hand-writing your notes. (Do not bring a computer).
Plan 20-30 minutes per Process. Don’t worry about precision at this point. The operator's educated guess is good enough.
Ask the questions in the Gemba Interview!!! Why is it being done this way? What ideas do the workers have?
Every member of your Value Stream Team is consciously attempting to observe the process with fresh eyes...
What’s done, by whom, in what sequence?
What barriers to flow are observed?
Even if the value stream you are mapping involves only paper and emails
Get out of the conference room, and go to the gemba where the people do the work.
Interview them. Look around the cubicles and computer screens with fresh eyes. LISTEN!!!
Even if you are mapping this same value stream for the umpteenth time...
Do NOT skip the gemba walk!
Map the flow of value
Back in your Team War Room (or whatever you call it)...
Create your Current State Value Stream Map, following the guidelines for how to use sticky notes to create a value stream map
Don't use an electronic value stream map yet.
It will just get in the way of team involvement and dialog.
Even if you already have an electronic map of this process, start over — mapping your current state on a fresh sheet of butcher paper, objectively documenting what your team observed TODAY.
The same value stream map using both sticky notes and software.
Learn how to (correctly) use sticky notes to create your Current State Value Stream Map
Map the information systems
In the Information Flow section your value stream map:
- Add a box or shape for each of the information systems that drive the flow of the information that drives the flow of the thing being transformed.
- Add arrows to indicate which direction(s) the information flows.
Tip: If this is the first time this value stream has been mapped, this can get real messy and embarrassing.
That's okay. You are beginning to experience the power of a value stream map — to make waste visible.
If you are not yet familiar with all of the sections of a value stream map, study that illustration.
Choose lean metrics
Choose a mix of both:
- Key Performance Indicators (KPI's)
- Key Behavioral Indicators (KBI's)
This is when your leaders will want to at least open a blank copy of your Systems2win Value Stream Mapping Power Tool
and click the button to 'Hide/Show Rows' > Show Rows to unhide the many rows of pre-defined lean metrics that are available to choose from.
If this is the first time this value stream has ever been mapped
then you might only gather only the extremely fundamental metrics
of 'Processing Time' and 'Queue Time'.
(If you're not familiar with those metrics, see the Lean Glossary)
you should also measure Percent Complete and Accurate.
And your team might choose a few additional metrics
that are particularly important to the success of this value stream.
If you are returning to a value stream that is further along on its lean journey
then you will really begin to appreciate the Value Stream Analysis features of your Systems2win Value Stream Mapping template.
Identify barriers to flow
Use burst shapes to highlight barriers to flow.
Walk the gemba again
When you walk the gemba the second time (often on the same day)...
this time collect data for your chosen metrics
(including flow of the information that controls the flow of the thing being transformed)
and be very open to observing new insights.
Caution: Be sure to observe what you chose to map
Make sure that you are observing an example of your chosen scenario of your chosen type of request for your chosen type of customer for your chosen segment of the value stream for your chosen Product Family.
Caution: Here is another way that Value Stream Teams often go wrong
When you observe the Current State, you are observing a snapshot of that process.
Whatever you see is "the way that process was at that moment."
Don't try to fudge your observations with your past experience of "what usually happens."
No matter how embarrassing it might be... simply observe and document.
Remember, in a functional (as contrasted with a dysfunctional) Continuous Improvement Team, the focus is never to blame. The focus is always to improve poorly designed systems that prevent excellence.
Try not to divert everyone else's attention to your profuse apologies and explanations of how unusual this is. Allow every team member (including you) to stay sharp and focused on observing what is happening in this process in this moment in time.
Finish your Current State Value Stream Map
Back in your war room...
populate your Current State Value Stream Map
with the data that you observed for your chosen lean metrics.
Here is the moment when some teams choose to transcribe their Current State map to electronic format
but usually not.
More commonly..
you use your value stream mapping template only to verify the accuracy of some of the more complex calculations,
and then you simply snap a photo of your messy sticky notes,
and rush off to barely make it to the conference room in time for the Executive Briefing
which is usually scheduled at the end of the first day of your (usually 3-day) value stream mapping event.
Sometimes Messy is Good
Many value stream leaders NEVER clean up a Current State Map into electronic format — instead choosing to always leave their Current State Maps in a permanent state of mess.
Why?
Because the subliminal impact is even more striking when the confusingly messy Current State Map is presented side-by-side next to the clean, legible, reassuring Future State Map.
Conduct your Current State Briefing Meeting
Use your PowerPoint Presentation of Results template
to present the Current State Value Stream Map to the stakeholders that you invited to your Briefing Meetings
(the stakeholders that you identified on the Communication Plan page of your Change Management template)
Facilitate dialog to reach consensus that:
- Your Current State Value Stream Map accurately reflects reality, and
- You have chosen appropriate metrics to Measure, Analyze, Improve, and Control your value stream
(not just Define it)
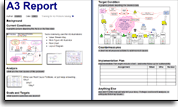 Extra credit: If you are are also using your A3 Report template
then there is consensus that the left side of the page contains an accurate summary of the problems and root causes currently plaguing this value stream
Usually, there are only a few small suggested changes
that your Team Leader and/or Facilitator can quickly change on your map
Value Stream Mapping Step 3
Conceive and evaluate possible Future States
Who: Value Stream Team
Ponder, Think, and Reflect
The most common schedule for a value stream mapping event is 3 back-to-back days
Advantages of this approach:
- Optimize the schedules
(and perhaps minimize travel time) for your many team members - Keeps the team focused
The compromise of this approach
is that it doesn't leave a lot of quality time to think, ponder, and reflect
so your team (and especially your leaders)
should be prepared for a sleepless night.
If travel is not an issue, then a more ideal schedule
will allow more time for Hansei
to reflect, ponder, and think about how to make your process better
Prepare your first draft Future State map
Option 1) Roll out a fresh roll of butcher paper
then duplicate the sticky notes from your Current State Map
to serve as the starting point for your team to begin designing your desired Future State
Option 2) Use a plotter printout of your electronic value stream map
Overnight, your leaders transcribe the messy sticky notes from your Current State Map into a legible, mathematically correct first draft Future State Map
that they then print on large plotter paper, so that you can still use sticky notes to edit as a team
Tip: Use scissors if a process needs to be moved.
Whenever you transcribe sticky notes to your electronic value stream map
always take the time with your team to compare and discuss differences
between the new electronic map and the original handwritten map.
Learn how to use your
value stream mapping template
Advantages of an electronic value stream map for designing your Future State
1) You learn more from your past
If this is not the first time that this value stream has been mapped,
then your team can pick up where you left off last time.
As you blend your freshly observed Current State with your most recent Future State, you will often gain insights that would have been lost.
"How is your Current State different from what you expected?"
"Which of your most recent plans were not implemented as expected?"
"How did this value stream change in ways that were not anticipated?"
2) It's easier to read and understand
It is easy to miss something when you can't even read it,
or when it's so sloppy that at first you think you understand...
but on closer inspection, it doesn't seem correct after all.
3) It clarifies your thinking
The important step of transcribing those messy sticky notes to the cleaner format of your value stream mapping template will clarify your thinking — often surfacing considerations that were originally overlooked
The right tools to
Define, Measure, Analyze, Improve, and Control
your value stream maps
(not just draw them)
4) It triggers new insights and ideas
Remember — your goal is to improve your value stream (not just map it).
And every time that you apply your collective human minds to clarify your thinking, it is almost inevitable to come up with new insights and ideas.
For this reason, the process of transcribing your thoughts from sticky notes into a cleaner format is not just "non-value-add housekeeping"...
it is an extremely important value-add step designed to trigger human thinking
(the primary value add reason for doing value stream mapping in the first place)
5) Help is instantly available
Even though your team might be manually editing your (plotter sized) printed map,
your electronic map is still instantly available to quickly click for instant help for lean terminology, shapes, methods, or math formulas that might be confusing.
6) The math is right
Even though your team might be manually editing your (plotter sized) printed map,
your electronic map is still instantly available to quickly answer (or verify) math questions.
7) More analytics are available
As your team matures over the years, the questions that you seek to answer tend to become more advanced.
Your value stream mapping template allows you to do many types of value stream analysis that would simply be too difficult to attempt without software.
And how would you even consider analyzing multiple scenarios on a single roll of butcher paper?
Don't let your software distract your leaders
Even if one of your value stream team leaders is so competent with your value stream mapping software that they could do both: Facilitate and edit the map — as real-time ideas fly...
That is a bad idea.
Your leaders need to focus on facilitating.
One important role in every value stream team is the 'Documenter'
(whose responsibilities are described in your 'Value Stream Team Roles' template. vsmTeamRoles.docx)
Your 'Documenter' frees your leaders to focus on facilitating
by taking primary responsibility for documenting things
like brainstorming ideas, Voice of the Customer, Product Family Matrix, Value Stream Mapping Design Guidelines, PowerPoint Presentation of Results for Executive Briefings, your Value Stream Plan,
and yes, (even though your Value Stream Manager is the primary Author) your Documenter also helps edit your value stream maps.
Don't let your lack of software distract your leaders
One important role of the Documenter is to answer (or verify) math questions.
Even if it is in a messy state of transition, your vsm template provides reassuringly correct answers to questions about formulas, math, symbols, techniques, or terminology that would otherwise distract your leaders from their primary responsibility — of leading.
If your team has an unusually deep bench
and if your team is fortunate enough to include a Documenter who is unusually skilled at using your value stream mapping software,
then (and only then) might it make sense to allow that Documenter to edit your electronic value stream map as real-time ideas fly.
(using a projector, rather than butcher paper)
Usually, the normal approach is to use sticky notes
no matter whether you are editing on butcher paper, or whether you are editing a plotter-sized print of your initial draft of your Future State Map.
And then your Documenter and/or other leaders transcribe those ideas to your (permanent, legible, shareable) electronic Future State Map later.
Start the Future State Kickoff
Your Change Agent congratulates the team for completing the Current State Map,
and expresses confidence that they will design a compelling and achievable future state that meets the charter objectives.
Design your Future State Value Stream Map
First ensure that the 'right work' is being done
before designing flow between processes
As you repeatedly revisit each value stream as your lean journey progresses, use your Systems2win Value Stream Mapping Design Guidelines templates, and publish your printed answers to those questions right on the same wall alongside your printed value stream maps and team charter to continuously improve:
- Value Stream Mapping Basic Design for Flow (vsmBasicDesign.docx)
- Design guidelines for handling variable Volume and Mix (vsmVolumeMix.docx)
- FIFO lanes, supermarkets, kanbans, and other pull systems
- Design guidelines for resource shared by multiple value streams (vsmShared.docx)
- Design guidelines for Lean Office and Service processes
- Design guidelines to incorporate your Supply Chain partners into your value streams
- Your Results
Plan for a 3-6 month horizon
There is no chance that any team will incorporate ALL of those design guidelines into their very first Future State Map.
Some teams might create 2 Future State Maps — for 3-6 months, and perhaps a more distant vision.
Highlight problems
Use bursts to highlight barriers to flow, and other problems.
Use clouds to highlight proposed countermeasures
Perhaps consider multiple scenarios
A Current State value stream map should NEVER depict more than one narrowly-defined scenario,
but a Future State value stream map might.
Learn how (and why) to depict multiple scenarios on one map.
Expand ideas and build consensus
Use your Systems2win tools for Idea Expansion and Consensus Building
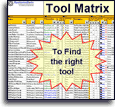
Your Tool Selection Matrix has a column to filter for tools that are useful to expand your thinking.
When you are making decisions this far-reaching and important in the short time of a (typical 3-day) Value Stream Event, a skilled facilitator should be prepared to introduce the team to any one of the many different
Get approval for your proposed Future State(s)
Who: Value Stream Team
Every lean tool needs
a corresponding
Lean Coaching System
Conduct a Briefing Meeting
At the Future State Executive Briefing
which is usually scheduled at the end of the second day of your 3-day value stream mapping event
use your 'Presentation of Results' PowerPoint template
to present your proposed Future State Value Stream Map to the stakeholders identified in your Change Management Planning template.
Obtain approvals.
Revise the Future State Map for feedback
If your Future State Map is already in electronic format,
then this step won't take long at all.
If your Future State Map is not yet in electronic format,
then this is definitely the time to convert those messy sticky notes
to your value stream mapping software — that can be shared, stored, and understood by people outside of your team.
At this point in your value stream mapping process,
you definitely want your proposed Future State Value Stream Map to be as legible, understandable, and persuasive as it can be,
so it's time to transcribe those messy sticky notes into a clean electronic document that can be shared with and understood by the workers, decision-makers, and stakeholders that will need to truly understand and 'buy into' your team's proposals for 'how to do things better'.
Value Stream Mapping Step 4
Get approval for your Value Stream Plan
Who: Value Stream Team
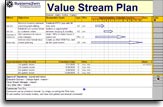
Create your Value Stream Transformation Plan
Use your Value Stream Plan template to define who will do what when.
Conduct a Briefing Meeting
Use your 'Presentation of Results' template
to present your proposed Value Stream Implementation Plan to your Executive Steering Committee and everyone else identified in your Change Management Planning template.
Obtain approval
Obtaining all necessary approvals might require a few days
Value Stream Mapping Step 5
Socialize your Maps and Plans
Who: Value Stream Team
Conduct Grand Rounds
It's not enough to just send an (easily missed) email announcing your new value stream maps and transformation plans.
This is far too important for that.
Socializing your maps and plans requires face-to-face presentation, with questions and answers.
The medical community has been doing "grand rounds" for decades, as a field-proven effective way to propose and/or disseminate new ways of doing things.
Call it whatever you want, but do it. Adopt it. Adapt it.
Don't just present. Listen, and respond.
Value Stream Maps and Plans are not meant to be static. Be ready to honestly listen and respond.
Where to publish your value stream map?
Far and wide.
At the extreme minimum:
- Conduct 'Grand Rounds' (as described above)
- Email it to every stakeholder that you identified on your 'Change Management' template (ChangeMgmt.xlsx)
- Have special meetings to give special attention to the potential concerns of every stakeholder identified on your 'Change Management' template
- Post a big plotter sized version of your value stream map somewhere near the gemba where the work is done
Additional ideas:
- Post a big plotter sized version near every one of the work areas that have any involvement in this value stream. Mark each map with a special symbol indicating "You are here"
- Ensure that your Human Resources Department uses your value stream map as a visual tool to orient new-hires to understand how their role affects and is affected by upstream and downstream processes
- When your VIP customers come to visit, start your facility tour in front of your value stream map, providing your visitors with a clear mental map of how things flow through the physical world they are about to tour
- Keep your printed value stream map in front of people
Not hidden within a computer, or (worse yet), hidden in a crumpled roll of butcher paper that might never be unrolled again
Electronic is Better
If you haven't already converted your Value Stream Maps to electronic form earlier,
you will definitely want to
use your value stream mapping template now
(following the instructions for how to use your value stream mapping template)
Advantages of an electronic value stream map for socializing your maps and plans
1) People can share it
Email it. Talk about it. Socialize it.
Your international team members can even view it in their own language.
2) People can read it
It tells your story clearly.
You're representing the work of your entire team;
why not make a professional presentation?
3) It is more effective
to get people on board with why change is needed,
and why your proposed changes make sense.
4) It is more visually appealing
Perhaps leave your 'As Was' map as a hand-written mess... just to make the psychological difference more striking
5) The math is right
You won't embarrass yourself with pocket calculator mistakes
6) You can archive it, and learn from your past
See the history of progress.
Notice what changed since the last time this value stream was mapped.
Learn from what worked, and what didn't.
7) You can easily edit it and redistribute the revised version
to prove that your team is honestly listening and responding to good ideas
which will then encourage even more and better ideas...
And isn't that the ultimate goal...
of this expensive and time-consuming exercise of value stream mapping?
to actually IMPROVE your value stream (not just map it)
Also see: Advantages for Future State Planning
Why these? Value Stream Mapping templates
Who should own your value stream map?
Your Value Stream Manager
Even if your team is fortunate enough to include a team member with the skills to perform the role of 'Documenter',
your Value Stream Manager is still the primary owner of the value stream, and Author of the value stream map.
Even if your (internal or external) consultant or facilitator helps to create your very first electronic map,
she should be grooming your Value Stream Manager to do it the next round.
This should be true for everything your consultant does for you
She shouldn't be doing Continuous Improvement for you.
She should be introducing tools and methods for your own people to improve your own processes.
This is YOUR value stream.
What tools do YOU choose to manage it?
Did your consultant leave you with teachable, repeatable systems?
Complete scheduled periodic reviews
At the scheduled times and places specified in your Value Stream Plan,
conduct periodic review of your updates to your Value Stream Plan and Future State Map.
For each Process Step in your Value Stream
Analyze, Stabilize, and Standardize
Who: The Coach, and Process Improvement Learner or Team for each process
Here's the bad news...
After doing all that hard work to form your team, map the current state, map the future state, create your value stream plan, and socialize your hard work to get everyone to buy in and agree to help make it real...
You still haven't changed anything
To actually transform your real-world processes,
you need to complete the next phase of your Lean Journey
to Analyze, Stabilize, Visualize, and Standardize
each process in your value stream
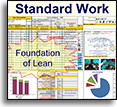
using your Standard Work templates, DMAIC tools, and Lean tools

Make it a habit
Who: Everyone involved
Do it again, and again
To be truly effective, this value stream management cycle should be repeated every 6 months.
Value Stream Mapping
Training & Demo Videos
Value Stream Mapping Videos
- Value Stream Mapping - Training Intro
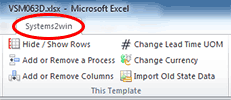
- Hide or Show Rows
- Add or Remove a Process
- How to use Excel as a Drawing Tool (several videos)
- Units of Measure
- Process Time & Cycle Time
- Lead Time
Additional relevant training
- Menu of Value Stream Mapping Topics
- Quick Start Initial Training
What every user should know to use any Systems2win template - How to use Link Icons to link to related documents
- How to Link Data between cells (video)
Some older videos show macro buttons... which have been replaced with menu items in the Systems2win menu in the Excel ribbon bar.
All value stream mapping videos are duplicated in this section, but you will get more value out them if you view them in the context of the related online training for your value stream mapping template and other value stream mapping software
Own the Value Stream Mapping template,
and the entire suite of Value Stream Mapping Tools
to empower every team member to improve every process
Contents
When to do Value Stream Mapping
in a Typical Lean Journey for Lean Transformation
- Phase 0)
Firefighting - Phase 1) Prepare Your Leadership
- Phase 2) Design Value Streams to Flow
- Phase 3) Analyze, Stabilize, Visualize, and Standardize each process
- Phase 4) Continuously Improve
Road map for a typical
Lean Transformation
Training and Coaching
Consider Training and Coaching to support your teams to succeed
Training to get you started.
Tools you won't outgrow.
Schedule a Conference
Schedule a conference
to discuss your challenges
with an experienced lean advisor
150+ Templates
Try Some
Own Them All
Download Trial Now
Get a dozen trial templates,
and another dozen free gifts
@@@ Better conversion rate
if call to action is for a specific tool, and shows the image
Try It
Try this template
along with a couple dozen more
process improvement tools
Calls to Action Botttom

Related Topics
Related Topics section WITHOUT TESTIMONIALS
Replace this paragraph with menu library item for topics related to this video
Training and Coaching
Consider Training and Coaching to support your teams to succeed
Training to get you started.
Tools you won't outgrow.
Schedule a Conference
Schedule a conference
to discuss your challenges
with an experienced lean advisor