
Process Improvement Tools.
Standard Work.
Work Instructions.
Flow Chart templates.
Swim Lane Cross Functional Flowchart.
Value Stream Mapping.
Lean tools.
Yamazumi Chart template.
Time Study templates.
DMAIC tools.
Quality Improvement tools.
House of Quality QFD.
FMEA Risk Reduction.
Root Cause Analysis tools.
Problem Solving tools.
OEE.
Preventive Maintenance.
Skip to main content


Installation and Setup
Installation - Each User. Installation - Multi-user. Language Translations. Personalize Your Templates.Systems2win Training.
Quick Start Initial Training. New User Training. Training Matrix. Systems2win Leadership. Training Classes.Lean Training
Lean Training and Coaching. Lean Principles. Muda 8 Wastes. Goal - Lean Flow. Roadmap - Lean Journey. Value Stream Mapping. Standard Work. Hansei Lean Thinking. Lean Dictionary. Online Lean Training. Lean Leadership.Microsoft Office Training
Excel Training. Excel Drawings (without Visio). Excel Charts. Word Training. PDF Training. Document Storage and Naming.Support
Support.Swim Lane Template
aka Cross Functional Flowchart, Swim Lane Process Map, Down-Across, Deployment Flowchart, Metrics Based Process Map, or Makigami Analysis
When to use your
Swimlane template
Your swimlane cross functional flowchart template is the ideal tool for service and administrative processes that get handed off between teams.
Examples: sales orders, proposals, quotes, purchasing, engineering changes, financial statement month end close...
Compare and choose between the many types of flowcharts
Why use your
Swim Lane Diagram template
- to visualize, analyze, and eliminate delays and waste
to improve the flow of a process that is worked on by multiple workers or teams
- to serve as standard work
to standardize the consistency of a process that crosses between functional teams or departments
- to do what Visio can't — (math)
If all that you want is art for your wall, then Visio will draw an attractive swimlane flowchart.
If you want to Measure, Analyze, Improve, and Control your process flows, then you will need math for things like cycle time, takt time, process time, lead time, smallest possible staff, and capacity. And perhaps different scenarios, for things like rush orders, or any differences in the ways that things sometimes flow.
That's why you use this Excel swim lane cross functional flowchart - a powerful drawing tool that does useful math.
Video: Swimlane Cross Functional Flowchart — Why and When?
What is a
Cross Functional Flowchart
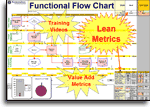
Your cross functional flowchart template (FlowSwim.xlsx or FunctionalFlow.xlsx)
has a swim lane for each person, department, or team that is involved with the process —
showing an intuitive graphic depiction of who is doing what, when, where, and for how long.
Sample Cross Functional Flowchart example. Download free trial
Prepare to use your
Swim Lane Diagram template
Swim Lane Flowchart Training Video
Before you just start entering data, you will get a lot more value from your efforts if you do these things first.
Video: Prepare to use your Swim Lane template
Define your Team Charter
Launch your team
using the same tools and systems that you use to launch any type of process improvement team
As you complete your Project Team Charter, thoroughly discuss:
- What are the beginning and ending boundaries of this process?
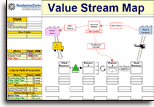
- Where does this process fit within the surrounding value stream?
Each functional flowchart will usually correlate to a single Process Flow Box on a Value Stream Map
- What is the one very narrowly-defined scenario that this team will observe and map?
This is where many process mapping teams go wrong.
If you are leading a mapping event to improve this process,
then you want to choose one very narrowly defined scenario, and keep your team's attention focused on it — without chasing rabbit trails of possible exceptions and different conditions.
If you are creating a flowchart to serve as a decision tree for standard work,
then you will want to learn how to use Paths and Scenarios.
- Who should be on this team?
A mapping team usually consists of 5-10 members. About half being workers from the process. Also representation from upstream suppliers, downstream customers, and outside eyes. Perhaps with standby support quickly available from supporting roles such as IT or maintenance. Use your Team Roles templates to clearly define the roles of your Leader, Facilitator, Executive Sponsor...
- Allow enough time for your mapping event
Typically 1-2 days for Current State, and 1 day for Future State
- What are the Objectives, Measures, and Targets by which the performance of this team will be evaluated?
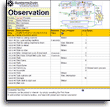
Observe the process
Use one of your Process Observation templates,
and follow the helpful instructions for how to correctly observe the process.
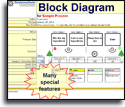
Perhaps start simpler
Some teams might choose to first sketch out the basic flow chart elements
using a Block Diagram, or sticky notes, or just pencil and paper,
and then when your team is ready,
transcribe those messy scribbled notes to a clean, legible, mathematically-correct presentation.
Transcribe that (sloppy) rough draft into your cross functional flowchart template — that isn't embarrassing to present to your boss's boss in your Presentation of Results meetings, and can be shared with (and understood by) the many stakeholders that your team will attempt to persuade and train to do things your suggested new ways.
New ways that might not be easily grasped or embraced by non-team members trying to make sense of a grainy, uneditable picture of hard-to-read sticky notes, supplemented with a few (perhaps less-than-reliable) hand-written numbers that came from someone's pocket calculator.
If you were the person that someone was trying to persuade to change your ways, wouldn't you prefer a clean, legible presentation with reliable math?
How to use your
Cross Functional Flowchart template
Find and open your template
Find and open your Functional Flowchart template
(FlowSwim.xlsx or FunctionalFlow.xlsx)
in the same way that you find and open your other 150+ Systems2win templates.
If you don't yet own a license, you can download your free trial now.
Save your working document
following the usual document storage and naming conventions established by your leaders
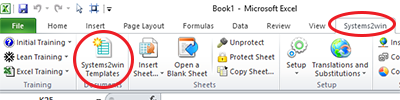
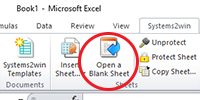
Open a Blank Sheet
When you're ready to start doing your own real work...
click the button to 'Open a Blank Sheet'
Excel Ribbon > Systems2win tab > Open a Blank Sheet
This blank sheet is where you will do your real work
(not on the Sample sheet — which gives you sample data that is extremely helpful for learning how to use your new tool, but is the wrong place to do your real work)
Rename your new sheet.
If English is not your preferred language
Switch to your language, just like every Systems2win Excel template.
Now your team is ready to start using your
Swim Lane template
Enter data in the header fields
Process Title
Name, title, and/or description of the Process
Scenario
Brief description of the conditions that the team will observe and map.
This is where many process mapping teams go wrong.
If you are leading a mapping event to improve this process,
then you want to observe and map one very narrowly defined scenario, and keep your team's attention focused on it — without chasing rabbit trails of possible exceptions and different conditions.
If you are creating a flowchart to serve as a decision tree for standard work,
then (and only then) you will want to learn how to use Paths and Scenarios.
Team
Identify the Document Author, Process Owner, Executive Sponsor, and other team members.
Links
Perhaps use Link Icons to link to related documents.
State
Usually Current or Future
Path
Path codes are an optional advanced feature.
Unless you know what you're doing, and have a strong reason to show multiple scenarios on a single flowchart, just leave this Path field blank.
Revised Date
To change date format... Right-click > Format Cells > Number tab
Takt Time
Perhaps use your Takt Time Calculation template (Takt.xlsx)
or use the 'Insert Sheet' button to insert that Take Time Calculator sheet into your workbook.
User Field 1
Optional
Define your Defaults
Do not skip this step!!!
Your data might not make any sense if you skip this step.
How can any math on your flowchart be correct if you haven't first defined your units of measure, work time available, and other defaults?
Below the print area in each flowchart sheet
On each flowchart sheet, below the lower right corner of the Print Area, there is a section labeled 'Start Here'
Enter your default data in the pink double-border cells.
Demand Unit of Measure
The unit of measure for both demand and production.
What is being delivered to the customer?
Examples of the thing being processed.
If your older template does not have this section, then upgrade now
Demand per Week
How many are needed per week?
Demand for ONLY the Product Family that this Value Stream produces.
If Sales & Operations Planning demand is different from actual customer demand, use S&OP demand. (In other words, plan to deliver the quantity that your management tells you to deliver.)
Weeks per User-Defined Demand Period
(This feature was released September 2019)
After entering Demand per Week, you can optionally convert demand into any other user-defined time period,
by using the 2 pink cells in the next row.
Cycle Time Unit of Measure
This is the one thing that needs to be defined on the 'Help' sheet, rather than on each worksheet.
Click the red anchor link icon to go to the 'Instructions' section of the 'Help' sheet
where you can use the dropdown list to choose your desired 'Cycle Time Unit of Measure'
which can be seconds, minutes, or hours.
If you change Cycle Time Unit of Measure, then:
- you must change it first — before entering any other data
- you must manually recalculate the workbook
Andon - Capacity
This defines the threshold for when you want to be alerted
when your Capacity is getting too close (for your comfort) to maybe not being able to meet your Customer Demand.
In other words, the value for Capacity will turn bold red to alert you
when (Capacity * this Andon %)
is less than or equal to Demand
Process ID?
If Process ID = TRUE,
then a unique process number will be automatically generated for each Process step.
If Process ID = FALSE,
then it won't
Either way, you also have the option to manually assign your own Step Numbers
using the text field above each Process Box
In the Systems2win menu
On each worksheet containing a flow chart,
in the Excel Ribbon bar, select
Systems2win menu > Change Lead Time UOM
then in the window that appears,
select your Lead Time Unit of Measure
At any time, you can switch between
- Working Days
- Calendar Days (including non-working days)
- Weeks
- Hours
To learn more, watch the training video for Units of Measure
In the lower right corner of each flowchart sheet
In the lower right corner of each flowchart sheet,
enter default values in the double-border pink cells
(see image)
Batch Size
Most processes in a functional flowchart will have a batch size of 1.
Tip: If you change Batch Size, then you might need to observe and enter new data for the revised process.
Online training for Factors to Consider when choosing Pulse Batch Size.
Work Time Available per Day
Work Time Available per Day is calculated using several of the pink double-border fields that you enter here.
Work Days per week — (typical)
Shifts per day — (typical)
Hours per shift — (typical)
Break Minutes per Shift — Lunch (or other major meal break) is usually excluded from Hours Per Shift, and should not be double-counted here.
Other Unavailable Time — Typical time per day unavailable to work on THIS value stream - due to things like other responsibilities, setup, clean up, routine maintenance, meetings...
Tip: Like every Systems2win template, you can optionally use your Custom Formula Zone to clarify "How did you come up with THAT number?"
Like every Systems2win template,
click any row or column header for pop-up help.
And for more thorough explanations,
see the on-line Lean Glossary
The training in this section focuses on only
default data in the pink double-border cells.
For training on the calculated values,
see the section for Lean Metrics
Cross Functional Flowchart
First Pass: Use Shapes to Show Process Flow
Define the start and end processes
Enter a description in the first process box and the last process box of your flowchart — thereby clearly defining where this process starts and ends.
Label the swim lanes
Notice that the Function Titles that you enter in the leftmost cells of each swim lane will also be automatically duplicated in cells near the right end of each swim lane.
Swim Lane Flowchart Video: First Pass: Use Shapes to Show Process Flow
Insert Snap To Grid shapes
If you don't already know... learn how to use Snap To Grid.
All of the Snap To Grid shapes are perfectly sized to snap to the largest cell associated with each process step.
There are 2 types of 'Snap To Grid' shapes:
- Blue-border shapes (use them now)
define the flow of the thing being processed.
There are pre-defined shapes for square Process Box, Decision Diamond, and several other less popular shapes.
And you can use what you learned in your New User Training, to format ANY Excel shape to be just like the (well-considered) formatting of any standard Systems2win shape.
- Green-border shapes (optionally use them later)
can be optionally be associated with a blue-border shape, to illustrate documents or data associated with a process step.
Green-border shapes for documents and data are usually entered later in the process — long after first entering the blue shapes to outline the fundamental flow of the process.
Green-border shapes are optional, because they are only one of three alternative ways to handle related documents and data.
Videos: How to use Excel
as a drawing tool
Draw with Excel
If you haven't yet learned how to use Excel as a Drawing tool, then now might be a good time to do that.
And then perhaps let your manager know that you will no longer need a license for any expensive and redundant drawing software that can't do math
Snap Off shapes
Later... after inserting all (or most) of your Snap To Grid shapes, and after completing most of your data entry and analysis (as described in the next training sections)...
then you will add the smaller Snap Off shapes.
Why wait? Because it is very common for your flowchart to change as you begin to analyze it deeper. So it is usually wise to wait to add your finishing touches as one of the last things that you do.
But we're going to teach you how to insert Snap Off shapes now... because you might want to add a few important Snap Off shapes sooner, rather than later.
When you're ready...
turn off Snap To Grid to add end points, text boxes, and other shapes
as well as arrows and connectors, which can snap and attach to other shapes
See training for connectors and arrows
which includes training for how to use Systems2win special features to connect multiple arrows to unusual places on shapes, and how to use backbone connectors to route arrows through awkward routes.
How to
Copy, Move, or Hide rows or columns
Notice that every Process box is associated with 4 rows & 6 columns.
Important - when you hide, copy, or move rows or columns, it is critical to keep related columns and rows together
Add or remove rows & columns
To size your work space as needed — use your button to 'Add or Remove Rows or Columns'.
First select a gold 'Process Time' cell in the work area, then click the button to 'Add or Remove Rows or Columns'.
You will then see a window asking to insert rows above or below, or columns to the left or right of your selected (gold) cell.
If using an older version that does not have the button to 'Add or Remove Rows or Columns', then follow the instructions (below) for how to hide, move, or copy, or request us to send you the latest update.
To hide rows or columns
Hide all related rows and columns together.
To add new rows
Use the button to 'Add or Remove Rows or Columns'
To copy or move rows or columns
Unprotect the sheet
Move or copy entire rows or columns
of the
groups of the 6 columns and 4 rows associated with each process.
Then quickly RE-PROTECT your sheet
to prevent accidentally deleting or changing formulas.
If you accidentally delete or mess up a formula,
you can usually repair it by simply copying a similar cell.
Excel training video:
How to add, copy, move
rows, columns, or cells
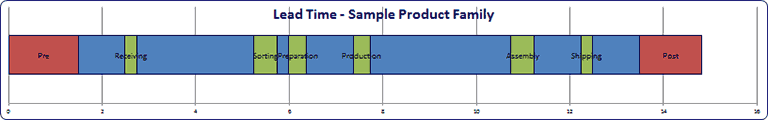
Update the Lead Time Chart
The Lead Time Chart instantly updates as your data changes...
with one exception...
If you ever manually copy, move, or delete columns...
then in the Systems2win tab in the Excel Ribbon bar, you need to click the button to 'Update Chart'
Tip: When you use the button to 'Add or Remove Rows or Columns'. the Lead Time Chart gets updated automatically.
To move a process
It is only okay to move entire rows or columns.
Do not move individual cells,
or groups of cells associated with an individual process.
(or you will royally mess up your formulas)
If you need to move a process, there are 2 safe ways to do it:
1) Recreate the data
and then move the shapes
and then delete the data from the old location
2) Use Paste Special > Formulas
and then move the shapes
and then delete the data from the old location
Cross Functional Flowchart
Second Pass: Enter Data
Enter headers, defaults, and blue boxes
We are assuming that you have already:
- Entered data in your headers (at the top of your flowchart)
- Entered your default data (in every one of the pink double-border cells, some of which are outside of the print area)
- Completed the first pass through your flowchart, where you used shapes to illustrate a rough outline of the flow of your process. (At this point, you will have used mostly blue boxes, with very few connector arrows, textboxes, or other shapes that will be added later)
If you haven't completed all three of those steps, then go back and complete them now.
Enter your data for each Process Box
In this section, you will learn
how to enter your data
in the 4 rows and 6 columns of cells surrounding each process box
See the picture, and notice how there is a LOT of optional information surrounding each process box.
Some of those cells contain formulas, and others allow you to enter (optional data.
All of the data fields are optional.
You can just complete the data that is relevant to what you're trying to understand about the process.
It may look like white space, but every Process Box is surrounded by 6 columns and 4 rows of cells.
Some contain formulas, and others are used for data entry.
Click each cell to view pop-up help.
The Process Box
The largest cell is the Process Box.
At this point, you should have already completed the first pass through your flowchart, using (mostly) blue boxes to create a rough outline of process flow.
Here is a quick recap of key points for this large 'Process Box':
- All 'Snap To Grid' shapes are perfectly sized to snap to grid to fit this cell.
- Blue-border shapes define the flow of the process.
After copying the appropriate blue shape, enter a brief description in the shape, usually starting with an action verb.
- Green-border shapes are one of several optional ways to clarify documents and data associated with each blue Process Box.
If they are used at all, most green-border shapes are usually added very late — after most other data has already been entered.
Chart Labels
aka Column Labels or Step Labels
The gold headers at the top of each column contain the labels that appear in the Lead Time Chart and Workload Balancing Chart.
There can be simultaneous processes in multiple swim lanes in each column. The labels that appear in your charts are the labels that you enter in the gold column header cells. The chart label should usually be identical to (or a briefer summary of) the label in the Process Box for the process with the longest process time in that column.
User Text Fields
The white cells just above and below the large Process Box are text fields that can be used for any purpose.
More correctly, they can be used for any text. You cannot use them for math.
There is also a third User Text field in the column farthest to the right of each Process Box.
By default, this starts out as a very narrow column, but you can easily make the column wider when needed.
These User Text Fields are often used as one of the optional ways to clarify documents and data associated with each blue Process Box.
Process ID
As already explained in the section above where you defined your Defaults...
If Process ID = TRUE,
then a unique process number will be automatically generated for each Process step.
If Process ID = FALSE,
then it won't
Either way, you also have the option to manually assign your own Step Numbers
using the text field above each Process Box
Processes to exclude from formulas
When you see the symbol ■,
that means that the process is being excluded from some formulas.
A process that doesn't happen at all
If the (black) ■ symbol is in the 'Path' cell,
the cell just to the right and above the Process box)
then that means that the process is not performed at all in your currently-selected Scenario/Path...
and therefore the process is excluded from all calculations when analyzing your currently-chosen scenario.
Remember: Paths and Scenarios are optional. You don't have to use them.
Dead End Process (not on the Critical Path)
If the (red) ■ symbol is in the 'Dead End' cell,
(the cell just to the right of the 'Path' cell)
then that indicates that this is a Dead End process (not on the Critical Path)
which will therefore be excluded from calculations for Lead Time and Cycle Time
while (correctly) still being included in calculations for Process Time, Value Add Time, and Steps.
This feature requires a template v15 R160800 or higher.
Who
When you click the cell to the lower right of a Process box,
a dropdown list will appear with a list of choices for 'Who' performs this Process Step.
Reminder: Like every Systems2win template, on the DV sheet, you can define your own choices for your own drop down lists
Number of Workers
If more than one person works together as a team to complete the work,
then in the cell 2 columns to the right of the Process Box, enter the number of workers.
If left blank, it assumes 1 worker.
Process Time
In the gold shaded cell beneath the Process Box
in the bottom of the 4 rows of data associated with each process...
enter the Process Time
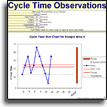
that you observed using one of your Time Observation templates
Process Time = Time that work is being done by a human being
(not just an unattended machine)
See online Lean Glossary to learn more about Processing Time
Process Time is measured in seconds, minutes, or hours
using the Cycle Time Unit of Measure that you chose in the Instructions section of the Help sheet
If there is more than one Worker
Then measure Process Time as if one worker were performing every step of the process.
Cycle Time is hidden, but is auto-calculated as = Process Time / # Workers
Notice that in the Time Sum Line beneath all the swim lanes, Cycle Time is shown for the one process that has the longest Cycle Time (in that column of simultaneous processes)
Learn more about Cycle Time
% Complete and Accurate
In the cream colored cell just to the right of Processing Time, enter the value for Percent Complete and Accurate
See online Lean Glossary to learn more about % Complete and Accurate
Lead Time
In the yellow cell just to the right of % Complete and Accurate, enter the value for Lead Time
Even though you can (at any time) use the button to switch the Lead Time Unit of Measure between Working Days, Calendar Days, Weeks, or Hours... the value that you enter in this cell must be in 'Working Days', and this cell will not change along with the other cells when you use the button to 'Change Lead Time UOM'
Lead Time and Queue Time
See the online Lean Glossary to learn more about the relationships between Lead Time and Queue Time
In the Lead Time cell for each process, you enter the number of Working Days for Lead Time
which includes both the time that it takes to do the step, and the time that it sits or waits before the next step begins.
If you are using an older template that instructs you to enter Queue Time, rather than Lead Time, then the math is a little different.
Your template will calculate Lead Time as the sum of all Queue Times + all Process Lead Times.
It will always include Process Lead Time as a a separate value from Queue time, so you need to enter the amount of Queue Time BETWEEN processes.
Get a free upgrade
If your Annual Maintenance is current, and you like the new way better...
(to enter 1 combined value for the Lead Time, considering both the Process Lead Time and the time that it waits AFTER each process...)
then you can request us to send you the latest new templates at any time.
Tip: It is often quite sufficient to use 'directionally correct' educated guesses for Lead Time, rather than wasting a lot of time gathering unnecessarily precise data
especially the first time that a process is being analyzed
perhaps becoming more precise in future rounds of continuous improvement.
Value Add
When you click the cell just above the yellow Lead Time cell,
you will find a dropdown list to choose a Value Add Code, or you can enter a number representing the percent of Process Time that is Value Add (as perceived by your customer).
See the training section for Value Add Analysis.
Related Documents and Data (several options)
In addition to the flow of Process Steps,
it is also common to use your functional flowchart to depict any documents and/or data that are associated with each process step.
There are several alternative ways to illustrate and analyze
the documents and data associated with each process step.
Option 1) Use a text cell
The fastest, easiest, and most space-efficient way to identify documents and other data repositories associated with a process is to simply list them in one of the 3 text fields surrounding each Process Box.
Most commonly the text cell just below the Process Box.
See the red circle in the illustration.
You can use any of the 3 user text fields.
Option 2) Green shapes
If space is available, you can use green shapes to make documents and data more visual.
Either:
- Increase row height to make room for the shape in the cell just below the Process Box
- Or you can use empty space in the swim lane below the process
This illustration shows both,
but you would choose one:
Either the (circled) brief list,
or the green shapes.
Option 3) The 'Information' Row
Just below the bottom swim lane, you can use the 'Information' row to itemize forms, screens, and databases that store and/or carry data information.
This 'Information' row can be used in place of, or in addition to text boxes or green shapes to identify data repositories, paper forms, and computer screens (as described above).
Optional: CRUDS (what are you doing with those documents and data?)
In addition to just listing the names of the documents and data related to a process,
it can also be helpful (but optional) to briefly explain what is being done with each document or data repository.
One popular way to do that is to use...
CRUDS codes
C - Create document or data at this step
R - Read document or data at this step
U - Update document or data (or alter it)
D - Destroy the document or data
Receipt of this document or data
S - Stimulates this step to begin
You can enter your CRUDS codes into any of the 3 User Text Fields, (above, below, and beside each Process Box),
or... because the 'Who' field is rarely used (because the Swim Lane Title usually clarifies 'who'), you might use its dropdown list for CRUDS analysis.
Both ways are shown in the illustration.
Optional: Re-engineering Matrix
If your cross functional flowchart gets too complex,
then you can untangle even the craziest process by supplementing your flowchart with your Process Re-engineering Matrix template (Reengineering.xlsx)
Links between related documents
Like all Systems2win templates, you can have bidirectional links between related documents.
1) To drill down to a related document
Use
Systems2win menu > Insert Link Icon
to insert an unlimited number of highly visual Link Icons
that allow you to create hyperlinks to an unlimited number of documents
anywhere in your swim lane cross functional flowchart
Learn more about Link Icons
Tip: To add a hyperlink to Link Icon in your swim lane flowchart, you need to Unprotect the sheet, (and then reprotect it, so that you don't mess up formulas).
For example, you might add multiple link icons to enable users to quickly drill down to related documents such as
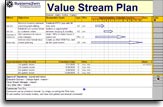
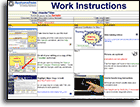
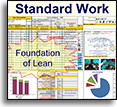
your value stream plan, visual work instructions, standard procedures, standard work, spaghetti diagrams, project plans, kaizen events, change management tools, other related flowcharts, and more

2) To roll data up from a related document
Learn how to link data between related documents
so that whenever data changes in one document, it also changes in the other
For example, you might link data to roll-up
from your cross functional flowchart to your value stream map (VSM.xlsx)
and/or Process Reengineering Matrix (Reengineering.xlsx)
Video: How to Link Data
to roll up from one worksheet or document to another
Two optional ways to handle
Complex sub-processes within a Swim Lane Flowchart
Option 1)
Drill down / Roll up
Follow the training in the section above
to use a single column with link icon(s) to drill down to another worksheet or workbook
that shows the full details of the flows of the sub-process
which is summarized in a single column on the higher-level flowchart.
Drill down / Roll up - Advantages
Cleaner, less cluttered high-level flowchart
Fewer Step Columns, (Lead Time Chart only supports a max of 40 Step Columns)
Advanced tips:
The column in the higher-level flowchart might contain a single Process Box,
or that column might have several Process Boxes
(to give a visual cue that multiple departments are involved... but without all the details that can be seen when the user clicks the Link Icon to drill down to the detailed flowchart for the sub-process)
Whenever you drill down or roll up between related documents
don't skip the training for document storage and naming conventions to avoid broken hyperlinks between related documents.
Option 2)
Share Lead Time
Rather than entering Lead Time for each process...
Enter a single Chart Label for just the first column header for the group of related processes.
Enter a single Lead Time for just the last process in the group of related processes.
Share Lead Time - Advantages
Single flowchart
Combining Lead Times is easier and more accurate (than individual lead times)
Advanced Tips:
This technique requires a template version 15.1 R180817 or higher.
If using an older template, contact Systems2win to get help to replace the Queue Time formula in the time sum line.
Perhaps visually delineate the group of related processes using a blue dashed Group Box
which you can copy from Systems2win menu > Copy Shapes
The Lead Time Chart will show some negative blue Queue Time before the first Queue Time
We wish we could write Excel for Microsoft, but that's how they handle it in their charts. Rather than offsetting the block of blue queue time right before the green process time, if the number is negative, they tack on an extra block of blue queue time before the process starts. The amounts are usually small, so the chart is usually still a valuable (only slightly inaccurate) graphic, but if it really bugs you, just drag the Lead Time Chart out of the Print Area.
Cross Functional Flowchart
Third Pass: Analyze and Improve
Analyze your 'As Is' process
Conduct your Executive Briefing Meeting to get consensus that everyone agrees that your 'As Is' process is an accurate representation for the way things really are now.
Copy your 'As Is' sheet to start your 'To Be' sheet
To Copy a Worksheet - use the special Systems2win utility
Excel Ribbon bar > Systems2win tab > Copy Sheet
If it has been a while since you completed your New User Training, you can refresh your memory about the Systems2win Copy Sheet utility
Encourage people to think
The most important purpose of any process improvement method
is to encourage people to think.
Use Hansei (again and again)
to systematically stimulate Lean Thinking.
Your swim lane diagram template has lots of lean metrics and charts to perform process analysis that sticky notes and Visio simply can't do.
If your company has not yet provided a license, you can download your free trial now.
Analyze Lean Metrics in your
Swim Lane Diagram template
If and when you add data to your visual swim lane flowchart,
then all of the following lean metrics will auto-calculate,
freeing your team to accomplish the objectives of your Project Charter, rather than getting side-tracked trying to do advanced math, or to invent tools.
See the Lean Glossary to learn more about any terms that are not yet familiar to you.
Lead Time — the time it takes to complete the process — from start to finish
Lead Time = The sum of the longest Lead Times for each column of simultaneous processes, for those processes that:
- Are not Dead End processes
Learn more about why and how some processes are sometimes excluded from some formulas.
- If you are using (optional) Path codes...
then the process needs to be included within your currently-select Path.
Lead Time Chart
In the Lead Time Chart, the blue segments illustrate the Queue Time between processes,
the longest Queue Time for any process in the column
and the green segments illustrate Cycle Time
the longest Process time for any process in the column.
The chart label comes from the gold header at the top of each column. This chart label should usually be identical to the label in the Process Box for the process with the longest process time in that column.
The Lead Time Chart instantly refreshes as your data changes, and it automatically updates when you use the button to 'Add or Remove Rows or Columns'
If you manually copy, move, or delete columns, however, then you must click the button to 'Update Chart'.
Tip: When you click the button to 'Update Chart', if you get the error 'The maximum number of data series per chart is 255',
then that means that your swimlane flowchart has more process columns than an Excel chart can handle. (approximately 40 column groups)
All other math and analyses in your cross functional flowchart are still correct, but your Lead Time chart will not be functional.
Option 1) Just ignore the lead time chart. Perhaps drag it out of the Print Area, and resize other charts or text boxes to fill the space.
Option 2) Reduce the number of process columns. (see training for how to handle sub-processes)
Queue Time — the time BETWEEN steps
Blue segments in the Lead Time Chart.
How long do things sit and wait for the next process to begin working again?
Process Lead Time — the time WITHIN each step
Green segments in the Lead Time Chart.
Process Lead Time = Pulse Batch Size * Cycle Time
Converted into the same unit of measure as Lead Time, which is usually 'Working Days'.
Process Time — time that work is being done by a human being (not just an unattended machine)
Measured in the Cycle Time Unit of Measure that you choose on the Help sheet — which can be seconds, minutes, or hours
Value Add Time — work that is value add from your end customer's perspective
See the training section below to learn how to do Value Add Analysis
Non Value Add Time — Process Time minus Value Add Time
Also known as 'Loss'.
Steps — a 'step' happens whenever the thing being transformed is handed off or delayed
Your flowchart counts the number of process boxes.
Because some process boxes might encompass sub-processes, this can be an imprecise number. If you really want to focus on counting and reducing Steps, you might want to use the User Data field.
Cycle Time — how often another 'thing being transformed' comes out the end of the pipeline
Cycle Time is calculated as
Process Time divided by number of workers
For more precise analysis of Cycle Time, use your Standard Work template
Takt Time — how often another 'thing being transformed' needs to come out the end of the pipeline to meet Demand
Learn more about Takt Time
Notice that if Cycle time is greater than Takt Time, then your number for Cycle Time will turn bold red to alert you that your plans won't meet your goals.
Like every Systems2win template,
click any row or column header for pop-up help.
And for more thorough explanations,
see the on-line Lean Glossary
The training in this section focuses on
only the calculated values. For training on the default data
(in the pink double-border cells)
see the section for Default Data
In the Systems2win menu, click the button for Print Area 2 to print just these summary metrics.

Capacity — how many can we produce?
Capacity per week = Work Time Available / Total Cycle Time
Notice that if Capacity is less than or equal to (Demand * Andon) then your number for Capacity turns bold red to alert you that your plans won't meet your goals.
Rolled First Pass Yield — the percent of deliverables that are received by the downstream operation or customer that do not need correction, addition, clarification, or rework.
Product of % Complete and Accurate for each step
User Data — see training section for optional user analysis
Value % of Time and Activity Ratio — embarrassingly small numbers that dramatically illustrate how much room there is for improvement
Use the dropdown list to toggle between:
Value % of Time = Value Add Time / Lead Time
Activity Ratio = Process Time / Lead Time
Notice that the pie chart also shows your choice of either Value % of Time or Activity Ratio.
Staff Level — how many full time employee equivalents are required?
Very important. No lean process improvement event should ever be used for staff reduction.
If your leaders have not yet widely published your organization's Job Security Promise, then they are definitely not lean leaders, and any workers participating in a potential head-cutting exercise should do so at their own risk.
(and brush up your resume to seek employment from an organization that demonstrates the same level of loyalty to their employees that they expect from their employees)
Work Time Available — with all the power of Excel to take into consideration all factors affecting your unique work schedule
Pulse (Pitch) — Pitch Pulse is the pace at which work is released and moves through the value stream
Departmental Metrics per Swim Lane
In addition to the bottom-line metrics, (in the lower right corner of your flowchart),
there are also calculations per swim lane
(found at the far right of your swim lane flowchart)
Swim Lane Flowchart Metrics
These swim lane metrics are especially useful to answer questions
for the managers of each department or functional area:
"How will these proposed changes affect my people?"
Process Time — For every unit processed,
How much time will be required from someone in this department or functional area?
Lead Time — How long do things sit in piles?
waiting for someone in this department or functional area to get around to working on them
% Complete and Accurate — What percent of deliverables come out of this department
without need for downstream correction, addition, clarification, or rework?
Value Add Analysis
In the cell below and 2 columns to the right of each Process box
(next to the cell for 'Who')
you can optionally enter codes and data for Value Add Analysis.
You can either use the pre-defined codes in the dropdown list, (and remember that all dropdown lists are defined on the DV sheet).
or you can enter any number between 0 and 100,
as an approximation of the percent of Process Time that is Value Add (as perceived by your customer)
0 is the same as the code for (completely) non-value-add,
and 100 is the same as the
▲ code for 100% value add.
Be careful, because blank is the same as non-value-add, and any other user-defined entry is the same as non-value-add.
This allows you the flexibility to do value add analysis both:
- The traditional way
- and to invent creative ways to analyze productivity in ways that are more useful than traditional value add analysis.
For example, for many Lean Office and Administrative processes, every process step is technically 'non-value-add' from the customer's perspective, which isn't very useful or motivating for the people charged with improving the process.
Note: The older version had the option to defined user-defined codes for the 'Value Add Include' field. That feature has been discontinued.
Swim Lane Flowchart
Optional User-Defined Analysis
Your swim lane flowchart template has several fields that can be creatively used for user-defined analysis of perhaps process- or industry-specific measure that are important to your unique process.
3 user text fields
The 3 text fields associated with each process can be used to document anything important to your process.
These 3 fields must remain formatted for text only. They cannot be used for math.
Makigami Analysis fields
You can also use for any creative purposes the 2 text fields inspired by Makigami Analysis — 'Information' and 'Problems' per column.
User-defined dropdown lists
Like every Systems2win template, it is possible to personalize any one (or 2) of those 3 user-defined text fields to use one of the user-defined dropdown lists (allowing users to choose from the dropdown list values that you define on the DV sheet)
And/or... you might choose to simply add some of your own user-defined values to the dropdown list that already exists for the 'Dead End' code.
User-defined comparison metrics
In the bottom section for Summary Metrics, there is a field called 'User Data', which is designed to be easily used for any metric that you desire.
You can also easily copy that row for unlimited user-defined metrics,
but only the first one will be pre-programmed to automatically find and import comparison data when you click the button to 'Import Old State Data'.
User-defined calculation
If you want to personalize your template to automatically calculate and analyze a user-defined metric that requires math, (perhaps cost? or distance traveled?)...
then if (and only if) you use only non-numeric codes for value add analysis,
then you can hire Systems2win to help you write
a formula that your team finds more valuable.
If you need assistance adding a custom formula, then Systems2win is optionally available at regular hourly billing rates. Custom programming is not part of free technical support.
Optional: Old State Comparison
You can optionally Import Old State Comparison Data for side-by-side comparisons, and delta change analysis.
Make sure that the other sheet is displaying the Scenario that you want to import, and its data has been recalculated.
Click the button to Import Old State Comparison Data
then recalculate: CTRL+SHIFT+ALT+F9
Side-by-Side State Comparisons
Things to notice:
- It does error checking to make sure that the imported data is a valid comparison
- The ∆ Delta Change formulas are directionally correct:
- Black is good
- Red is bad
- Grey requires human judgment to determine whether an up or down change is good or bad
- You have the option of either entering manual comparison data and/or importing from another worksheet with the click of a button
- When you click on any row or column heading (in any Systems2win template) pop-up help will appear
Your Cross Functional Flowchart template is designed to make it truly easy for you to:
- Start out by making a simple flowchart drawing, and then, when you're ready...
- Enter data to easily analyze the effects of proposed changes
Learn more about Import Old State Comparison Data
Optional: Paths and Scenarios
Perhaps add scenarios
We suggest that you wait until you have finished analyzing and improving your most common scenario
before adding data for multiple Path Codes and Scenarios to analyze different possible situations on a single flow chart.
On the same flowchart, you can use Path Codes and Excel Scenarios
to illustrate (and calculate) different Paths through which the thing being processed might flow.
Animated image, showing two Scenarios for Typical vs. Rush Order
(This is an image of the older version cross functional flowchart template)
Learn more how to use Path codes and Scenarios
to depict and analyze multiple possible process flows on one flowchart, without wasting your time re-drawing an almost-identical flowchart for each scenario.
In the pre-defined Scenarios on the Sample page,
you can learn from these two different scenarios:
1) Typical Learning
2) Expedited Learning
Tip: Often, a simple verbal description in the 'Exceptions' text box is sufficient
only creating an Excel Scenario
for those situations that deserve in-depth study
Highlight Problems and Ideas
Do not skip this step!
Barriers to Flow
One of the primary reasons for creating a cross functional flowchart is to
Identify and eliminate barriers to flow
You seriously don't want to gloss over this step.
Learn more about barriers to flow
You can enter (very) brief Barriers to Flow
in any of the 3 text cells surrounding each Process Box.
To (optionally) add a lot more detail about Barriers to Flow,
you can use Cell Comments,
and/or Links to related documents,
and/or the large text box below the swim lanes.
Improvement Ideas
The 'Improvement Ideas' text box is also found near the bottom of your swimlane flowchart template, (and can be easily dragged within or outside of the Print Area).
Use it as a catch-all for ideas whenever they arise.
And then facilitate brainstorming and consensus-building for which ideas to implement first.
Makigami Analysis — Problems
Optionally itemize problems for each column, using text or (perhaps colored) text boxes.
Remember that you can use Alt+Enter for 'paragraphs' within a cell.
In addition to (or in place of) this 'Problems' row, you can also use Bursts to highlight problems anywhere on your flowchart.
Clouds and Bursts
As you analyze your Current State map,
add bursts to highlight the biggest problems and opportunities for improvement.
As you analyze your Future State map,
add clouds to highlight ideas for countermeasures to your biggest problems
When an idea gets approved,
shade the cloud.
Learn more about clouds and bursts
Action Plans
When an idea gets approved,
- Shade the cloud on your map
(to indicate that the countermeasure has been approved)
- Add items to your Action Plan
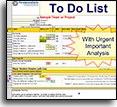
You have several choices of templates to serve as your Action Plan:
Publish and Socialize
Do not skip this step!
Conduct Briefing Meetings
Use your 'PowerPoint Presentation of Results' template
to present your Current State map to the stakeholders that you invited to your Briefing Meetings
(the stakeholders that you identified on the Communication Plan page of your Change Management template)
Facilitate dialog to reach consensus that:
- Your Current State Value Stream Map accurately reflects reality, and
- You have chosen appropriate metrics to Measure, Analyze, Improve, and Control your process
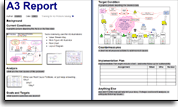
- If you are are also using your A3 Report template
then there is consensus that the left side of the page contains an accurate summary of the problems and root causes currently plaguing this value stream
And then conduct a second Future State Briefing Meeting
to obtain approvals for your proposed plans.
Publish and socialize your results
Summarize your problem, tools and methods used, and success results,
perhaps using one or more of these tools:
- A3 Report Storyboard (A3.xlsx or A3Report.docx)
- PowerPoint Presentation of Results (eventResults.pptx)
- Project Charter (TeamCharter.xlsx)
Socialize your results
the same way that you socialize results for your Standard Work improvements.
Hold the team accountable for results
Establish a system for your executive and mid-level managers to monitor expected vs. actual results over time,
perhaps using one or more of these tools:
- Process Analysis (ProcessAnalysis.xlsx)
- Value Stream Action Plan (vsmActionPlan.xlsx)
- Event Audit (eventAudit.xlsx)
See additional training for how to measure results
Continuously Improve
Monitor Progress
Your Executive Change Agent should schedule periodic meetings (at least monthly)
to measure results, and ensure that your team actually accomplishes the mission of your team charter.
Rinse and repeat
Continuous improvement should be continuous.
Just like the value stream mapping cycle,
this process mapping cycle should be habitually repeated every 6 to 12 months.
Own this
Swim Lane Diagram template
with many other Process Improvement Tools to analyze, improve, and standardize any process
Contents
New User Training
Your Systems2win templates come with free New User Training
to quickly learn features that are common to all 150+ templates
Easily switch between
languages

Download Free Trial
If your organization has
not yet provided a license,
download your free trial now
Own Yours Now
Own your own professional tools
that you can take with you for the rest of your career
Training and Coaching
Consider Training and Coaching to support your teams to succeed
Training to get you started.
Tools you won't outgrow.
Schedule a Conference
Schedule a conference
to discuss your challenges
with an experienced lean advisor
150+ Templates
Try Some
Own Them All
Download Trial Now
Get a dozen trial templates,
and another dozen free gifts
@@@ Better conversion rate
if call to action is for a specific tool, and shows the image
Try It
Try this template
along with a couple dozen more
process improvement tools
Calls to Action Botttom

Related Topics
Related Topics section WITHOUT TESTIMONIALS
Replace this paragraph with menu library item for topics related to this video
Training and Coaching
Consider Training and Coaching to support your teams to succeed
Training to get you started.
Tools you won't outgrow.
Schedule a Conference
Schedule a conference
to discuss your challenges
with an experienced lean advisor